> All in One 586

Ads

Wednesday, December 2, 2020

How to Make an Area Chart With CSS

You might know a few ways to create charts with pure CSS. Some of them are covered here on CSS-Tricks, and many others can be found on CodePen, but I haven’t seen many examples of “area charts” (imagine a line chart with the bottom area filled in), particularly any in HTML and CSS alone. In this article, we’ll do just that, using a semantic and accessible HTML foundation.

A red area chart against a dark gray background.

Let’s start with the HTML

To simplify things, we will be using <ul> tags as wrappers and <li> elements for individual data items. You can use any other HTML tag in your project, depending on your needs.

<ul class="area-chart">
  <li> 40% </li>
  <li> 80% </li>
  <li> 60% </li>
  <li> 100% </li>
  <li> 30% </li>
</li>

CSS can’t retrieve the inner HTML text, that is why we will be using CSS custom properties to pass data to our CSS. Each data item will have a --start and an --end custom properties.

<ul class="area-chart">
  <li style="--start: 0.1; --end: 0.4;"> 40% </li>
  <li style="--start: 0.4; --end: 0.8;"> 80% </li>
  <li style="--start: 0.8; --end: 0.6;"> 60% </li>
  <li style="--start: 0.6; --end: 1.0;"> 100% </li>
  <li style="--start: 1.0; --end: 0.3;"> 30% </li>
</li>

Here’s what we need to consider…

There are several design principles we ought to consider before moving into styling:

  • Units data: We will be using unit-less data in our HTML (i.e. no px, em , rem , % or any other unit). The --start and --end custom properties will be numbers between 0 and 1.
  • Columns width: We won’t set a fixed width for each <li> element. We won’t be using % either, as we don’t know how many items are there. Each column width will be based on the main wrapper width, divided by the total number of data items. In our case, that’s the width of the <ul> element divided by the number of <li> elements.
  • Accessibility: The values inside each <li> is optional and only the --start and --end custom properties are required. Still, it’s best to include some sort of text or value for screen readers and other assistive technologies to describe the content.

Now, let’s start styling!

Let’s start with general layout styling first. The chart wrapper element is a flex container, displaying items in a row, stretching each child element so the entire area is filled.

.area-chart {
  /* Reset */
  margin: 0;
  padding: 0;
  border: 0;

  /* Dimensions */
  width: 100%;
  max-width: var(--chart-width, 100%);
  height: var(--chart-height, 300px);

  /* Layout */
  display: flex;
  justify-content: stretch;
  align-items: stretch;
  flex-direction: row;
}

If the area chart wrapper is a list, we should remove the list style to give us more styling flexibility.

ul.area-chart,
ol.area-chart {
  list-style: none;
}

This code styles all of the columns in the entire chart. With bar charts it’s simple: we use background-color and height for each column. With area charts we are going to use the clip-path property to set the region that should be shown.

First we set up each column:

.area-chart > * {
  /* Even size items */
  flex-grow: 1;
  flex-shrink: 1;
  flex-basis: 0;

  /* Color */
  background: var(--color, rgba(240, 50, 50, .75));
}

To create a rectangle covering the entire area, we will reach for the clip-path property and use its polygon() function containing the coordinates of the area. This basically doesn’t do anything at the moment because the polygon covers everything:

.area-chart > * {
  clip-path: polygon(
    0% 0%,     /* top left */
    100% 0%,   /* top right */
    100% 100%, /* bottom right */
    0% 100%    /* bottom left */
  );
}

Now for the best part!

To show just part of the column, we clip it to create that area chart-like effect. To show just the area we want, we use the --start and --end custom properties inside the clip-path polygon:

.area-chart > * {
  clip-path: polygon(
    0% calc(100% * (1 - var(--start))),
    100% calc(100% * (1 - var(--size))),
    100% 100%,
    0% 100%
  );
}

Seriously, this one bit of CSS does all of the work. Here’s what we get:

Working with multiple datasets

Now that we know the basics, let’s create an area chart with multiple datasets. Area charts often measure more than one set of data and the effect is a layered comparison of the data.

This kind of chart requires several child elements, so we are going to replace our <ul> approach with a <table>.

<table class="area-chart">
  <tbody>
    <tr>
      <td> 40% </td>
      <td> 80% </td>
    </tr>
    <tr>
      <td> 60% </td>
      <td> 100% </td>
    </tr>
  </tbody>
</table>

Tables are accessible and search engine friendly. And if the stylesheet doesn’t load for some reason, all the data is still visible in the markup.

Again, we will use the --start and --end custom properties with numbers between 0 and 1.

<table class="area-chart">
  <tbody>
    <tr>
      <td style="--start: 0; --end: 0.4;"> 40% </td>
      <td style="--start: 0; --end: 0.8;"> 80% </td>
    </tr>
    <tr>
      <td style="--start: 0.4; --end: 0.6;"> 60% </td>
      <td style="--start: 0.8; --end: 1.0;"> 100% </td>
    </tr>
  </tbody>
</table>

So, first we will style the general layout for the wrapping element, our table, which we’ve given an .area-chart class:

.area-chart {
  /* Reset */
  margin: 0;
  padding: 0;
  border: 0;

  /* Dimensions */
  width: 100%;
  max-width: var(--chart-width, 600px);
  height: var(--chart-height, 300px);
}

Next, we will make the <tbody> element a flex container, displaying the <tr> items in a row and evenly sized:

.area-chart tbody {
  width: 100%;
  height: 100%;

  /* Layout */
  display: flex;
  justify-content: stretch;
  align-items: stretch;
  flex-direction: row;
}
.area-chart tr {
  /* Even size items */
  flex-grow: 1;
  flex-shrink: 1;
  flex-basis: 0;
}

Now we need to make the <td> elements cover each other, one element on top of each other so we get that layered effect. Each <td> covers the entire area of the <tr> element that contains it.

.area-chart tr {
  position: relative;
}
.area-chart td {
  position: absolute;
  top: 0;
  right: 0;
  bottom: 0;
  left: 0;
}

Let’s put the magical powers of clip-path: polygon() to use! We’re only displaying the area between the --start and --end custom properties which, again, are values between 0 and 1:

.area-chart td {
  clip-path: polygon(
    0% calc(100% * (1 - var(--start))),
    100% calc(100% * (1 - var(--end))),
    100% 100%,
    0% 100%
  );
}

Now let’s add color to each one:

.area-chart td {
  background: var(--color);
}
.area-chart td:nth-of-type(1) {
  --color: rgba(240, 50, 50, 0.75);
}
.area-chart td:nth-of-type(2) {
  --color: rgba(255, 180, 50, 0.75);
}
.area-chart td:nth-of-type(3) {
  --color: rgba(255, 220, 90, 0.75);
}

It’s important to use colors with opacity to get a nicer effect, which is why we’re using rgba() values. You could use hsla() here instead, if that’s how you roll.

And, just like that:

Wrapping up

It doesn’t matter how many HTML elements we add to our chart, the flex-based layout makes sure all the items are equally sized. This way, we only need to set the width of the wrapping chart element and the items will adjust accordingly for a responsive layout.

We have covered one technique to create area charts using pure CSS. For advanced use cases, you can check out my new open source data visualization framework, ChartsCSS.org. See the Area Chart section to see how area charts can be customized with things like different orientations, axes, and even a reversed order without changing the HTML markup, and much more!


The post How to Make an Area Chart With CSS appeared first on CSS-Tricks.

You can support CSS-Tricks by being an MVP Supporter.


from CSS-Tricks https://ift.tt/3qnHdjJ
via IFTTT

Tuesday, December 1, 2020

Cloudy/Wind today!


With a high of F and a low of 19F. Currently, it's 31F and Mostly Cloudy/Wind outside.

Current wind speeds: 26 from the North

Pollen: 0

Sunrise: December 1, 2020 at 07:52PM

Sunset: December 2, 2020 at 05:29AM

UV index: 0

Humidity: 62%

via https://ift.tt/2livfew

December 2, 2020 at 10:01AM

Painting With the Web

Matthias Ott, comparing how painter Gerhard Richter paints (do stuff, step back, take a look) to what can be the website building process and what can wreck it:

[…] this reminds me of designing and building for the Web: The unpredictability, the peculiarities of the material, the improvisation, the bugs, the happy accidents. There is one crucial difference, though. By using static wireframes and static layouts, by separating design and development, we are often limiting our ability to have that creative dialogue with the Web and its materials.

Love that. I’ve long thought that translating a mockup directly to code, while fun in its own way, is a left-brained task and doesn’t encourage as much creativity as either playing around in a design tool or playing around in the code while you build without something specific in mind as you do it. You don’t just, like, entirely re-position things and make big bold changes as much when your brain is in that mode of making something you see in one place (a mockup) manifest itself in another place (the code).

Direct Link to ArticlePermalink


The post Painting With the Web appeared first on CSS-Tricks.

You can support CSS-Tricks by being an MVP Supporter.


from CSS-Tricks https://ift.tt/35SNbiP
via IFTTT

AWS announces Panorama a device adds machine learning technology to any camera

AWS has launched a new hardware device, the AWS Panorama Appliance, which, alongside the AWS Panorama SDK, will transform existing on-premises cameras into computer vision enabled super-powered surveillance devices.

Pitching the hardware as a new way for customers to inspect parts on manufacturing lines, ensure that safety protocols are being followed, or analyze traffic in retail stores, the new automation service is part of the theme of this AWS re:Invent event — automate everything.

Along with computer vision models that companies can develop using Amazon SageMaker, the new Panorama Appliance can run those models on video feeds from networked or network-enabled cameras.

Soon, AWS expects to have the Panorama SDK that can be used by device manufacturers to build Panorama-enabled devices.

Amazon has already pitched surveillance technologies to developers and the enterprise before. Back in 2017, the company unveiled DeepLens, which it began selling one year later. It was a way for developers to build prototype machine learning models and for Amazon to get comfortable with different ways of commercializing computer vision capabilities.

As we wrote in 2018:

DeepLens is deeply integrated with the rest of AWS’s services. Those include the AWS IoT service Greengrass, which you use to deploy models to DeepLens, for example, but also SageMaker, Amazon’s newest tool for building machine learning models… Indeed, if all you want to do is run one of the pre-built samples that AWS provides, it shouldn’t take you more than 10 minutes to set up … DeepLens and deploy one of these models to the camera. Those project templates include an object detection model that can distinguish between 20 objects (though it had some issues with toy dogs, as you can see in the image above), a style transfer example to render the camera image in the style of van Gogh, a face detection model and a model that can distinguish between cats and dogs and one that can recognize about 30 different actions (like playing guitar, for example). The DeepLens team is also adding a model for tracking head poses. Oh, and there’s also a hot dog detection model.


Amazon has had a lot of experience (and controversy) when it comes to the development of machine learning technologies for video. The company’s Rekognition software sparked protests and pushback which led to a moratorium on the use of the technology.

And the company has tried to incorporate more machine learning capabilities into its consumer facing Ring cameras as well.

Still, enterprises continue to clamor for new machine learning-enabled video recognition technologies for security, safety, and quality control. Indeed, as the COVID-19 pandemic drags on, new protocols around building use and occupancy are being adopted to not only adapt to the current epidemic, but plan ahead for spaces and protocols that can help mitigate the severity of the next one.


from Amazon – TechCrunch https://ift.tt/3oqsoev
via IFTTT

A Microsite Showcasing Coding Fonts

We made one! It’s open source if you want to make it better or fix things.

There are quite a few purpose-built fonts for writing code. The point of this site is to show you some of the nicest options so you can be aware of them and perhaps pick one out to try that suites your taste.

We used screenshots of the code to display just so we could show off some of the paid fonts without managing a license just for this site, and for fonts without a clear way to link them up (like San. Also because setting up the screenshotting process was kinda fun.

High Fives

Special high five to Jonathan Land who helped a ton getting the site together including literally all the design work. Also to Sendil Kumar who had the original idea for a blog post like this, before the idea grew up into a full blown microsite. And finally to all the contributors so far.

Work

There are still more fonts to add. If you want to add one, feel free to make a PR. Or if you’re unsure if it will be accepted or not, open an issue first. I’d like to keep any of the fonts we add fairly high quality. There is also a current bug with some of the ligatures not showing properly in the screenshots of some of the fonts. I’m sure we’ll sort it out eventually, but I’d love an assist there if you are particularly knowledgeable in that area.

Open issues here.


The post A Microsite Showcasing Coding Fonts appeared first on CSS-Tricks.

You can support CSS-Tricks by being an MVP Supporter.


from CSS-Tricks https://ift.tt/3fXVwGP
via IFTTT

Amazon announces a bunch of products aimed at industrial sector

One of the areas that is often left behind when it comes to cloud computing is the industrial sector. That’s because these facilities often have older equipment or proprietary systems that aren’t well suited to the cloud. Amazon wants to change that, and today the company announced a slew of new services at AWS re:Invent aimed at helping the industrial sector understand their equipment and environments better.

For starters, the company announced Amazon Monitron, which is designed to monitor equipment and send signals to the engineering team when the equipment could be breaking down. If industrial companies can know when their equipment is breaking, it allows them to repair on it their own terms, rather than waiting until after it breaks down and having the equipment down at what could be an inopportune time.

As AWS CEO Andy Jassy says, an experienced engineer will know when equipment is breaking down by a certain change in sound or a vibration, but if the machine could tell you even before it got that far, it would be a huge boost to these teams.

“…a lot of companies either don’t have sensors, they’re not modern powerful sensors, or they are not consistent and they don’t know how to take that data from the sensors and send it to the cloud, and they don’t know how to build machine learning models, and our manufacturing companies we work with are asking [us] just solve this [and] build an end-to-end solution. So I’m excited to announce today the launch of Amazon Monotron, which is an end-to-end solution for equipment monitoring,” Jassy said.

The company builds a machine learning model that understands what a normal state looks like, then uses that information to find anomalies and send back information to the team in a mobile app about equipment that needs maintenance now based on the data the model is seeing.

For those companies who may have a more modern system and don’t need the complete package that Monotron offers, Amazon has something for these customers as well. If you have modern sensors, but you don’t have a sophisticated machine learning model, Amazon can ingest this data and apply its machine learning algorithms to find anomalies just as it can with Monotron.

“So we have something for this group of customers as well to announce today, which is the launch of Amazon Lookout for Equipment, which does anomaly detection for industrial machinery,” he said.

In addition, the company announced the Panorama Appliance for companies using cameras at the edge who want to use more sophisticated computer vision, but might not have the most modern equipment to do that. “I’m excited to announce today the launch of the AWS Panorama Appliance which is a new hardware appliance [that allows] organizations to add computer vision to existing on premises smart cameras,” Jassy told AWS re:Invent today.

In addition, it also announced a Panorama SDK to help hardware vendors build smarter cameras based on Panorama.

All of these services are designed to give industrial companies access to sophisticated cloud and machine learning technology at whatever level they may require depending on where they are on the technology journey.


from Amazon – TechCrunch https://ift.tt/3lx4yvn
via IFTTT

Who’s building the grocery store of the future?

The future of grocery stores will be a win-win for both stores and customers.

On one hand, stores want to decrease their operational expenditures that come from hiring cashiers and conducting inventory management. On the other hand, consumers want to decrease the friction of buying groceries. This friction includes both finding high-quality groceries at consumers’ personal price points and waiting in long lines for checkout. The future of grocery stores promises to alleviate, and even eliminate, these points of friction.

Amazon’s foray into grocery store technology provides a succinct introduction into the state of the industry. Amazon’s first act was its Amazon Go store, which opened in Seattle in early 2018. When customers enter an Amazon Go store, they swipe the Amazon app at the entrance, enabling Amazon to link purchases to their accounts. As they shop, a collection of ceiling cameras and shelf sensors identify the items and places them in a a virtual shopping cart. When they’re done shopping, Amazon automatically charges for the items they grabbed.

Earlier this year, Amazon opened a 10,400-square-foot Go store, about five times bigger than the largest prior location. At larger store sizes, however, tracking people and products gets more computationally complex and larger SKU counts become more difficult to manage. This is especially true if the computer vision AI-based system also must be retrofitted into buildings that come with nooks and crannies that can obstruct camera angles and affect lighting.

Perhaps Amazon’s confidence in its ability to scale its Go stores comes from vertical integration that enables it to optimize customer experiences through control over store format, product selection and placement.

While Amazon Go is vertically integrated, in Amazon’s second act, it revealed a separate, more horizontal strategy: Earlier this year, Amazon announced that it would license its cashierless Just Walk Out technology.

In Just Walk Out-enabled stores, shoppers enter the store using a credit card. They don’t need to download an app or create an Amazon account. Using cameras and sensors, the Just Walk Out technology detects which products shoppers take from or return to the shelves and keeps track of them. When done shopping, as in an Amazon Go store, customers can “just walk out” and their credit card will be charged for the items in their virtual cart.

Just Walk Out may enable Amazon to penetrate the market much more quickly, as Amazon promises that existing stores can be retrofitted in “as little as a few weeks.” Amazon can also get massive amounts of data to improve its computer vision systems and machine learning algorithms, accelerating the speed with which it can leverage those capabilities elsewhere.

In Amazon’s third and latest act, Amazon in July announced its Dash Cart, a departure from its two prior strategies. Rather than equipping stores with ceiling cameras and shelf sensors, Amazon is building smart carts that use a combination of computer vision and sensor fusion to identify items placed in the cart. Customers take barcoded items off shelves, place them in the cart, wait for a beep, and then one of two things happens: Either the shopper gets an alert telling him to try again, or the shopper receives a green signal to confirm the item was added to the cart correctly.

For items that don’t have a barcode, the shopper can add them to the cart by manually adding them on the cart screen and confirming the measured weight of the product. When a customer exits through the store’s Amazon Dash Cart lane, sensors automatically identify the cart, and payment is processed using the credit card on the customer’s Amazon account. The Dash Cart is specifically designed for small- to medium-sized grocery trips that fit two grocery bags and is currently only available in an Amazon Fresh store in California.

The pessimistic interpretation of Amazon’s foray into grocery technology is that its three strategies are mutually incompatible, reflecting a lack of conviction on the correct strategy to commit to. Indeed, the vertically integrated smart store strategy suggests Amazon is willing to incur massive fixed costs to optimize the customer experience. The modular smart store strategy suggests Amazon is willing to make the tradeoff in customer experience for faster market penetration.

The smart cart strategy suggests that smart stores are too complex to capture all customer behaviors correctly, thus requiring Amazon to restrict the freedom of user behavior. The more charitable interpretation, however, is that, well, Amazon is one of the most customer-centric companies in the world, and it has the capital to experiment with different approaches to figure out what works best.

While Amazon serves as a helpful case study to the current state of the industry, many other players exist in the space, all using different approaches to build an aspect of the grocery store of the future.

Cashierless checkout

According to some estimates, people spend more than 60 hours per year standing in checkout lines. Cashierless checkout changes everything, as shoppers are immediately identified upon entry and can grab products from the shelf and leave the store without having to interact with a cashier. Different companies have taken different approaches to cashierless checkout:

Smart shelves: Like Amazon Go, some companies utilize computer vision mounted on ceilings and advanced sensors on shelves to detect when shoppers take an item from the shelf. Companies associate the correct item with the correct shopper, and the shopper is charged for all the items they grabbed when they are finished with their shopping journey. Standard Cognition, Zippin and Trigo are some of the leaders in computer vision and smart shelf technology.

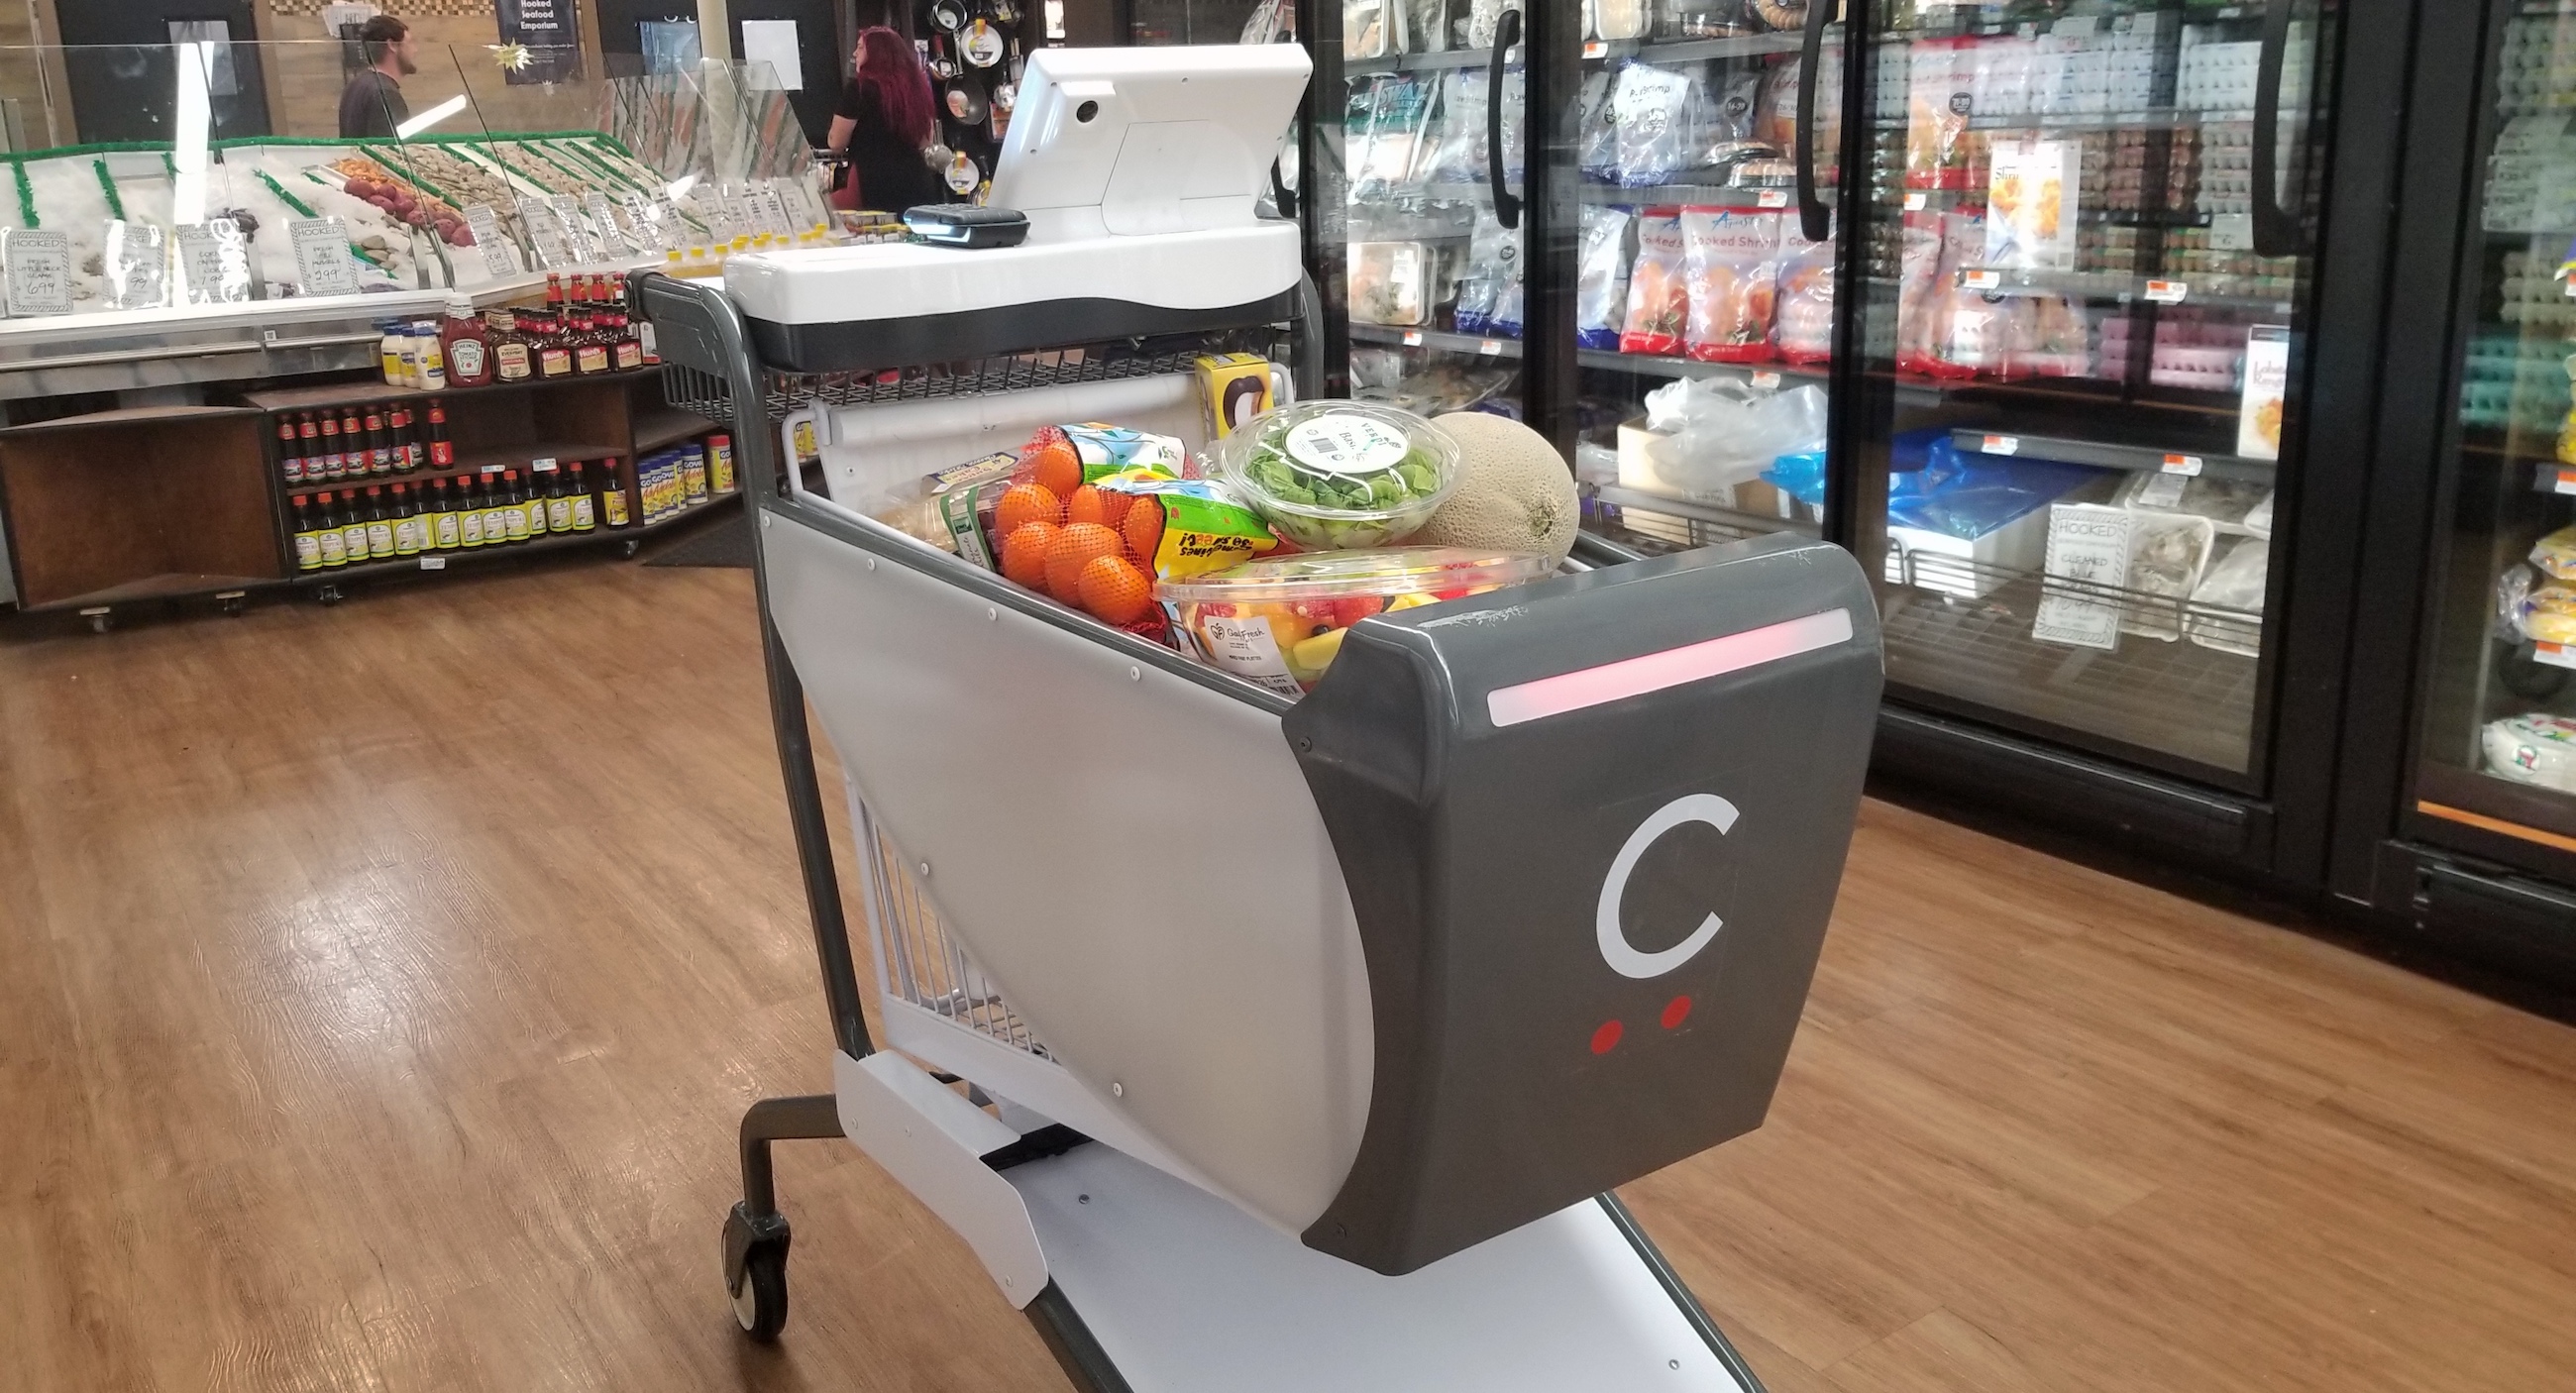
Smart carts and baskets: Like Amazon’s Dash Cart, some companies are moving the AI and the sensors from the ceilings and shelves to the cart. When a shopper places an item in their cart, the cart can detect exactly which item was placed and the quantity of that item. Caper Labs, for instance, is pursuing a smart cart approach. Its cart has a credit card reader for the customer to checkout without a cashier.

Touchless checkout kiosks: Touchless checkout kiosk stations use overhead cameras that verify and charge a customer for their purchase. For instance, Mashgin built a kiosk that uses computer vision to quickly verify a customer’s items when they’re done shopping. Customers can then pay using a credit card without ever having to scan a barcode.

Self-scanning: Some companies still require customers to scan items themselves, but once items are scanned, checkout becomes quick and painless. Supersmart, for instance, built a mobile app for customers to quickly scan products as they add them to their carts. When customers are finished shopping, they scan a QR code at a Supersmart kiosk, which verifies that the items in the cart match the items scanned using the mobile app. Amazon’s Dash Cart, described above, also requires a level of human involvement in manually adding certain items to the cart.

Notably, even with the approaches detailed above, cashiers may not be going anywhere just yet because they still play important roles in the customer shopping experience. Cashiers, for instance, help to bag a customer’s items quickly and efficiently. Cashiers can also conduct random checks of customer’s bags as they leave the store and check IDs for alcohol purchases. Finally, cashiers also can untangle tricky corner cases where automated systems fail to detect or validate certain shoppers’ carts. Grabango and FutureProof are therefore building hybrid cashierless checkout systems that keep a human in the loop.

Advanced software analytics


from Amazon – TechCrunch https://ift.tt/3lqkO1d
via IFTTT

Showers Early today!

With a high of F and a low of 65F. Currently, it's 82F and Clear outside. Current wind speeds: 9 from the Southeast Pollen: 3 Su...